Table of Contents
Chart Coloring
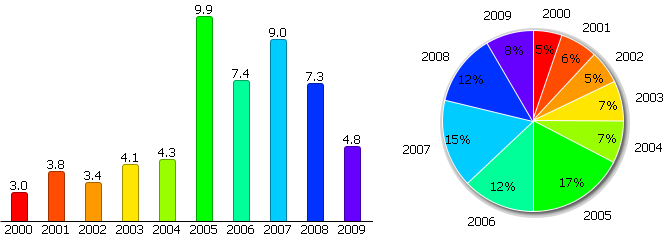
The library supports different color variations. If color makes no matter, developer can use a default value. Otherwise, color can be specified with the definite value or with a function.

Fixed color
In this case all chart elements have one color. The method is more appropriate for Bar Charts than for Pie Charts.
var chart =  new dhtmlXChart({
    color:"#66cc33",
    …
})
Color template
In this case color of chart elements specifies with the template instead of fixed value as a color property :
/*color is set in data object*/
var data = [
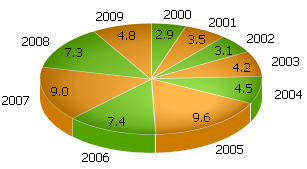
    { sales:"7.3", year:"2008", color:"#880000"},
    { sales:"4.8", year:"2009", color:"#000088"}
];
var chart1 =  new dhtmlXChart({
    …
    color:”#color#”
})
/*colors are set depending on object values*/
var chart2 =  new dhtmlXChart({
    ...
    color:function(obj){
       if (obj.sales > 5) return "#ff9900";
       return "#66cc00";
    }
})
/*alternative colors*/
var chart3 =  new dhtmlXChart({
    ...
    color:function(obj){
   	index++;
	if (index % 2) return "#ff9900";
	return "#66cc00";
    }
});

Color gradient
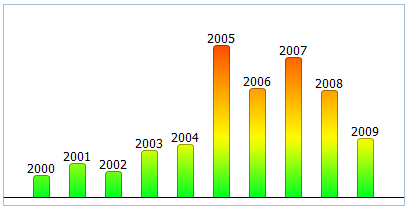
Bar charts allow to define color gradient for bars. It can be done using a function that takes a gradient object as an argument.
In this case we can assign colors to the gradient object by using the addColorStop() method:
addColorStop(position, color)
- position - a number between 0.0 and 1.0 that defines the relative position of the color in the gradient,
- color - a string representing a CSS color.
var chart =  new dhtmlXChart({
	…
	gradient:function(gradient){
		gradient.addColorStop(0.0,"#FF0000");
		gradient.addColorStop(0.8,"#FFFF00");
		gradient.addColorStop(1.0,"#00FF22");
	}
})
