Labels
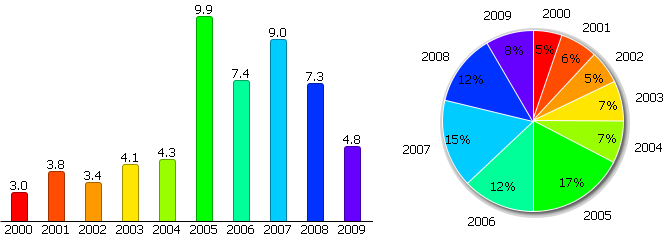
You may define labels for objects those a chart will represent. Line and Bar charts show labels above elements, pie charts – outside sectors.

Labels are defined by templates:
var chart =  new dhtmlXChart({
             …
	label:"#sales#"
})
Pie chart allows to define labels inside its sectors as well - 'pieInnerText' property:
var chart =  new dhtmlXChart({
	…
        label:"#year#",
	pieInnerText:function(obj){
		var sum = chart.sum("#sales#");
		return Math.round(obj.sales/sum*100) +"%"
	}
});