Sorting
In most cases we need to display values in a certain order. It isn’t a problem if incoming data are already ordered. But if sorting is necessary, you may use built-in chart sorting. It is rather easy and can be applied to the same chart several times.
Data can be sorted by sort property in the dhtmlxChart constructor or by sort() method. Sorting requires the following properties to be set:
- by - a template for the property that the chart is sorted by,
- dir - a sorting direction: “asc” or “dsc”,
- as - a sorting method: “int”, “string”, “string_strict” (case-sensitive “string”) or custom
var data = [
	{ sales: 4.1, year: 2003 },
	{ sales: 4.3, year: 2004 },
	{ sales: 3.0, year: 2000 },
	{ sales: 3.8, year: 2001 },
	{ sales: 3.4, year: 2002 },
	{ sales: 7.3, year: 2008 },
	{ sales: 4.8, year: 2009 },
	{ sales: 9.9, year: 2005 },
	{ sales: 7.4, year: 2006 },
	{ sales: 9.0, year: 2007 }
];
var chart =  new dhtmlXChart({
	view:"bar",
	container:"chart_container",
        value:"#sales#",
	label:"#sales#",
	xAxis:{
	    template:"#year#",
	    title:"Sales per year"
	},
	sort:{
	    by:"#sales#",
	    dir:"asc",
	    as:"int"
	}
})
chart.parse(data,"json");
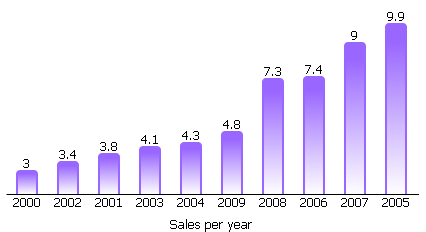
Here is the result of sorting by sales:

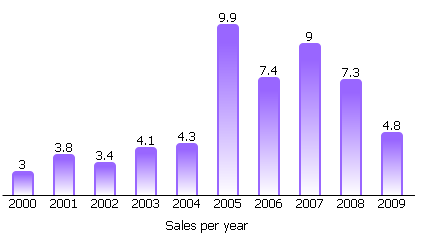
But if we change the sorting property, the result will be different:
chart.sort({
        by:"#year#",
        dir:"asc",
        as:"int"
});

Custom sorting method
There are three defined sorting methods: “int”, “string” and “string_strict”. If neither of these methods aren't appropriate, you may set a new method.
A sorting method is defined by a function. This function is called for each pair of values and returns 1,-1 or 0:
- 1 - the object with the first value in pair must go before the second one,
- -1 - the second object goes before the first,
- 0 - the order of both objects doesn't change.
For example, if we need to sort by time property that consists of minutes and seconds divided by ”:” than the following custom sorting can be used:
chart.sort({
        by:"#time#",
        dir:"asc",
        as: sortTime
});
function sortTime(a,b){
        a = a.split(":");
        b = b.split(":");
        if(a[0] > b[0]) return 1;
        else if(a[0] < b[0]) return -1;
        else{
            if(a[1] > b[1]) return 1;
            else if(a[1] < b[1]) return -1;
 	    return 0;
	}
}
An example that uses mentioned above methods you can see here.